Laboratory Temperature and Humidity Monitoring System - Robert Valdez
The problem
Small variations in both temperature and humidity have been known to disrupt and/or influence various laboratory-based parameters that are at the core of rock and sediment mechanics research. More specifically, we often observe 1) temperature-based fluctuations in pore fluid pressure during long-term (i.e. weeks to months) deformation and consolidation experiments and 2) humidity-based changes in frictional behavior during short-term (i.e. a few to several hours) unconfined shearing experiments. This project aims to continuously monitor the ambient conditions in our laboratory to help improve the quality of our data.
Instrumentation and setup
The main components required for this project are all readily available from SparkFun and are as follows:
- Sparkfun RedBoard
- Atmospheric Sensor
- LCD screen
- LED lights
- 10k ohm resistors
- 330 ohm resistors
- 10k trimpot
- push button
- Jumper wires
All of the components listed above, excluding the atmospheric sensor, can be obtained by purchasing the sparkfun inventors kit.
The electrical build (Figure 1a) is rather straightforward, with all of the components being controlled by the RedBoard. The 16x2 LCD screen and the pushbutton shown in the schematic are required to display the various parameters (temperature, humidity, atmospheric pressure, and altitude) measured from the atmospheric sensor. The main parameters (i.e. temperature and humidity) are shown on the LCD screen as the default setting, but when the pushbutton is active the text on the screen changes to pressure and altitude. The primary function of the LED lights is to notify the user when the system is successfully running (solid green light) and to show the output rate of the atmospheric sensor (yellow blinking light). This system is then placed in an enclosure to allow for mobility and easy deployment into different environments (Figure 1b).
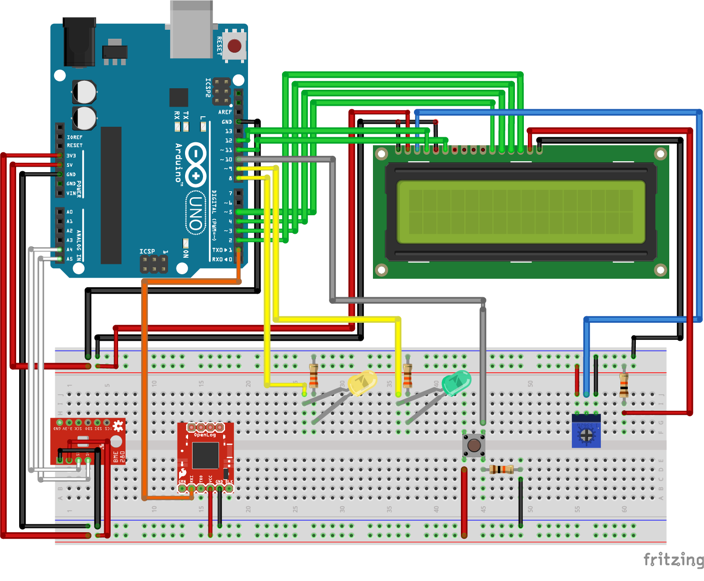
Figure 1a - Schematic of the electrical circuit for this project.
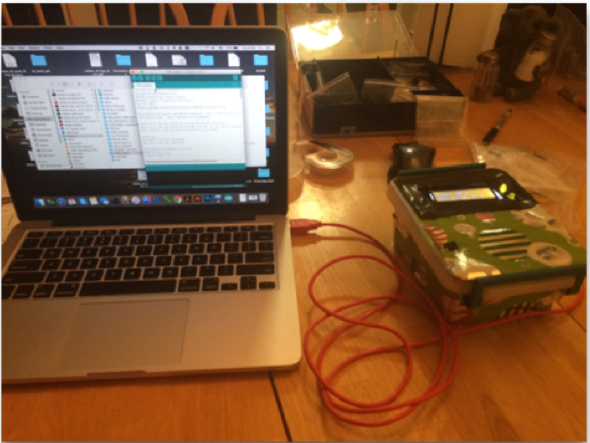
Figure 1b - Picture of the system being connected to a computer with a USB cord.
Results
An example of data collected from this setup is shown below (Figures 2-3).
To test the functionality of this system, I exposed the atmospheric sensor to different temperature and humidity conditions. This took the form of a common freezer and conventional oven. Not surprisingly, the temperature starts to decrease with time then increase once the ambient conditions were changed (i.e. from the freezer to the oven). The relative humidity shows a similar pattern, with low values in the freezer and higher values near the oven. The drastic increase in humidity could also be a result of condensation build up in the enclosure after exposing it higher temperatures.

Figure 2 - Temperature recording over 1 hr time window. The monitoring system was exposed to cold (freezer) followed by warm temperatures (oven).

Figure 3 - Relative humidity recording over the same 1 hr time window.
Challenges
The challenges encountered in this project mainly revolved around 1) failure to implement other instruments into this monitoring system and 2) coding errors. I was not able to successfully implement the data-logging instrument into the system (i.e. https://www.sparkfun.com/products/13712), which made this system a “monitoring” rather than a “logging” system. However, I was able to actively record the output of the atmospheric sensor using the CoolTerm application. This application (http://freeware.the-meiers.org) allows the user to connect to the monitoring systems serial port and write its output to a text file. The data shown in Figures 2-3 were collected using this software while the systems was running. The coding errors are also linked to the data-logging instrument problem in that I was not able to successfully get these different components to sync with each other.
Future work
As part of my future work, I plan to address the challenges listed above. Specifically, I’d like to record data without actively using an outside application. Once the system is successfully recording data, I’d like to implement a wifi module so that this data is readily available online. This can be completed using the SparkFun Thing (https://www.sparkfun.com/products/13231), which allows the user to upload data to a server (i.e. https://data.sparkfun.com/). Once it is available online, I’ll plot this data in real time so that others experimentalists at Penn State can view the temperature and humidity logs at their leisure. Lastly, I’d like to have this completely battery powered so that it is no longer tied to a computer.